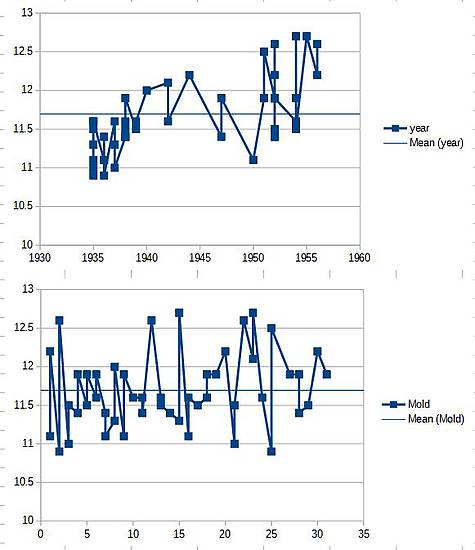
These graphs show the weight by year and weight by mold for a group of 50 baby signals made between 1935 and 1956. All of these came from the same mold set -- which was made in 1934 with large lettering, and reworked in 1938 to have smaller letting. The top chart by year shows this, with the weights in 1935-1938 all tightly clustered below the average line. In 1938, the weights increased, as did the variability among the insulators. The minimum weight was 10.9 ounces, maximum was 12.7, average 11.7, and a standard deviation of 0.5. I'm not entirely sure how to interpret the chart on the bottom, with the weights by mold. There does seem to be a significant variability between the same mold (though note that in general I only have 2-3 samples per mold). This view also mixes the 1934 (lighter) mold set with the 1938 (heavier) mold set, so this might be exaggerating the variability somewhat. It is interesting to note that this range of 1.8 ounces, or about 15%, occurs on automated machinery. Even excluding the 1934 mold set, you have a range of 1.6 ounces, or about 13%. I had always thought that automatic machinery would keep the weights more constant that is shown here. Keep in mind that the majority of the pieces measured here are pretty much mint and clean, so there should be minimal variability caused by damage or dirt. It is possible (likely, even) that the molds had additional work done on them over time, so some of this variability might be due to these changes over time. More study required! |