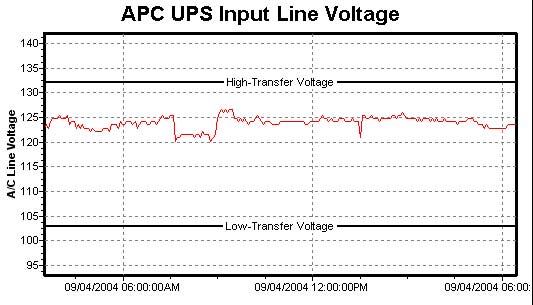
Here is a graph of the voltage at my house for the last day. We have not had any abnormal events, storms, etc. so I assume these fluctuations are normal. I have seen them before. You can see the voltage go between 120 and 127. If it is outside the given range, it switches to battery operation. |